Europe dries out
2022 was the driest year ever recorded. Using climate data I created a series of maps showing soil moisture levels across Europe. The visualisation reveals where drought reached exceptional levels, caused by a combination of low rainfall and prolonged heat. It became front-page news.
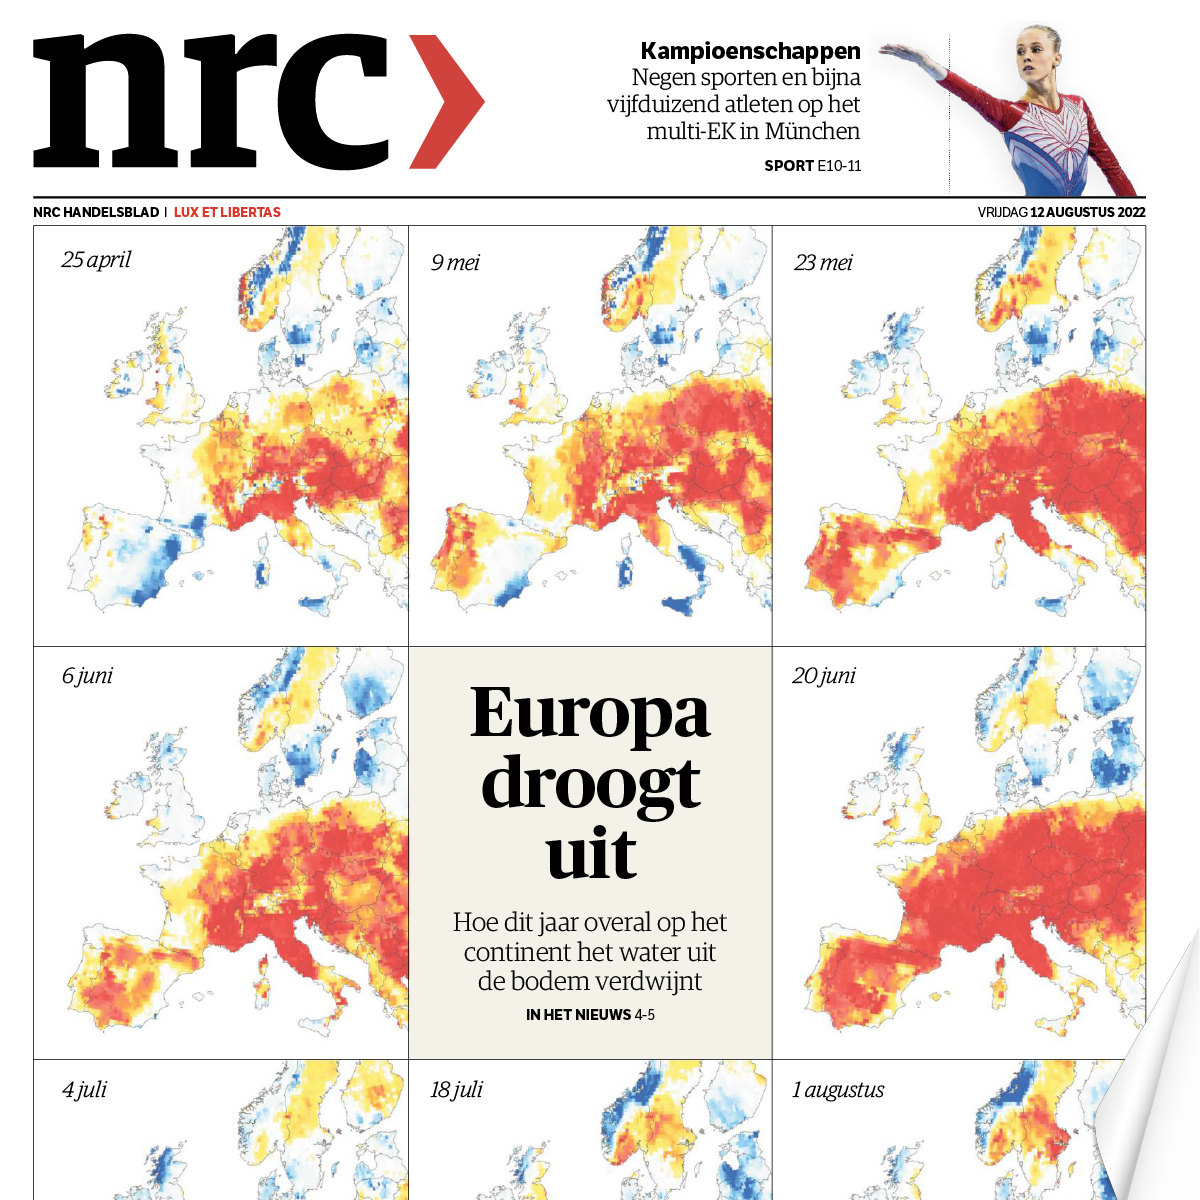
NRC front page showing the increase in drought across Europe.
Illegal livestock farming in the Amazon
NRC investigated 22 slaughterhouses in the Amazon in Brazil that export meat to Europe the United Kingdom and China. In the areas where these slaughterhouses source their cattle forest the size of half the Netherlands has disappeared in the past six years.
Using detailed deforestation data I showed the scale of deforestation over recent decades: 80% of all Amazon land that once had forest is now used for livestock farming.
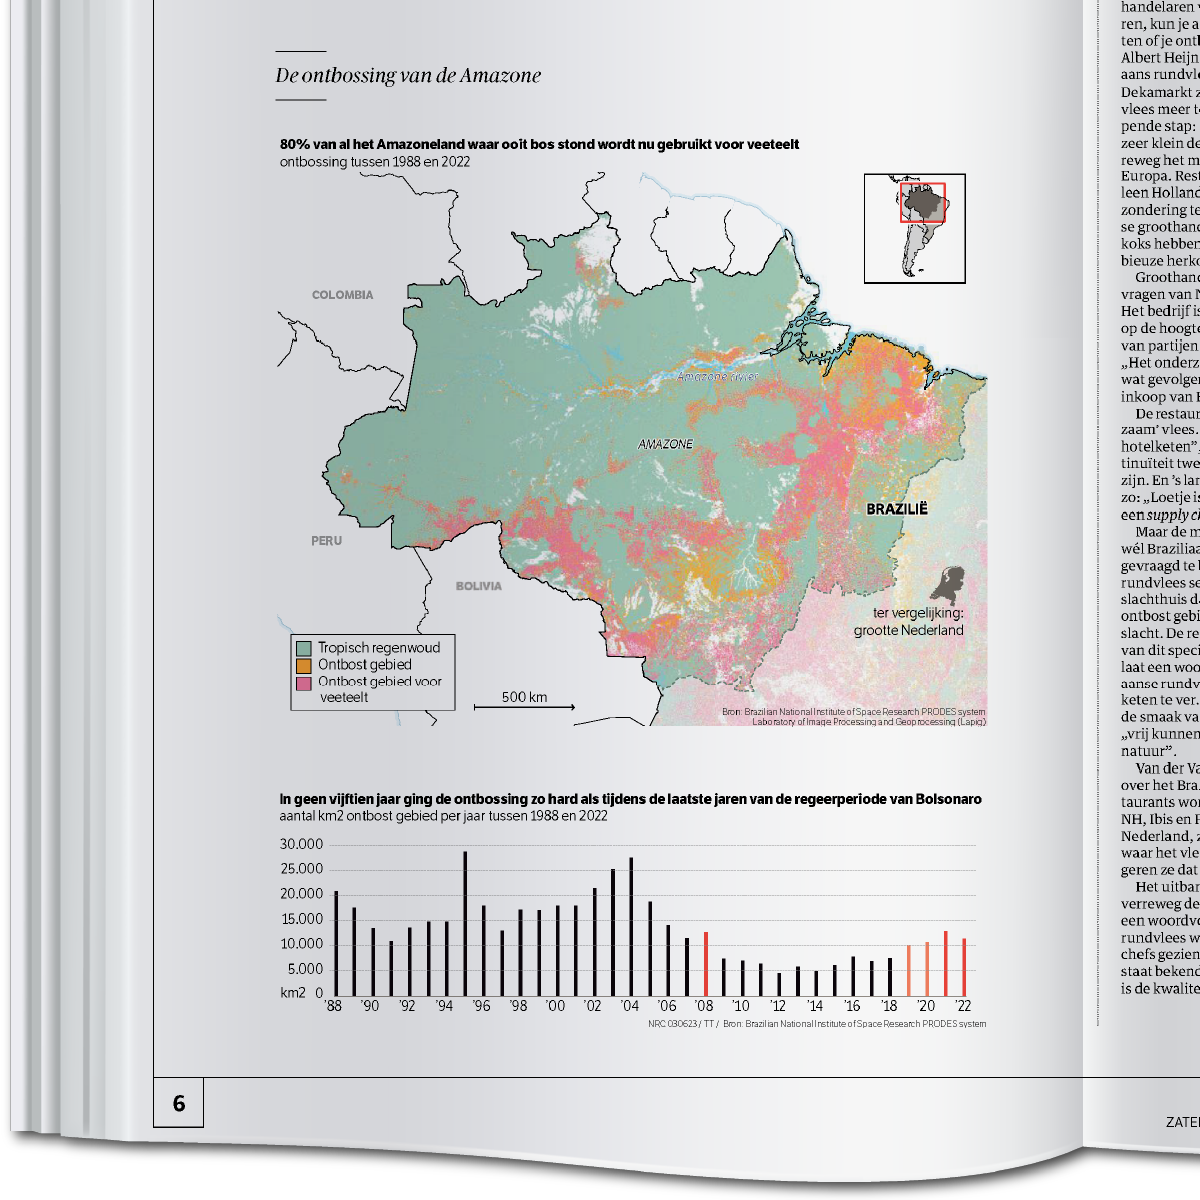
Using satellite imagery I show where illegal livestock farming is taking place in the Amazon.
Iceberg A23
In March 2023 something remarkable happened: the ice sheet that broke off Antarctica 40 years ago ran aground three thousand kilometres further north at South Georgia. For this NRC article I translated satellite data into visualisations of the journey of iceberg A23a.
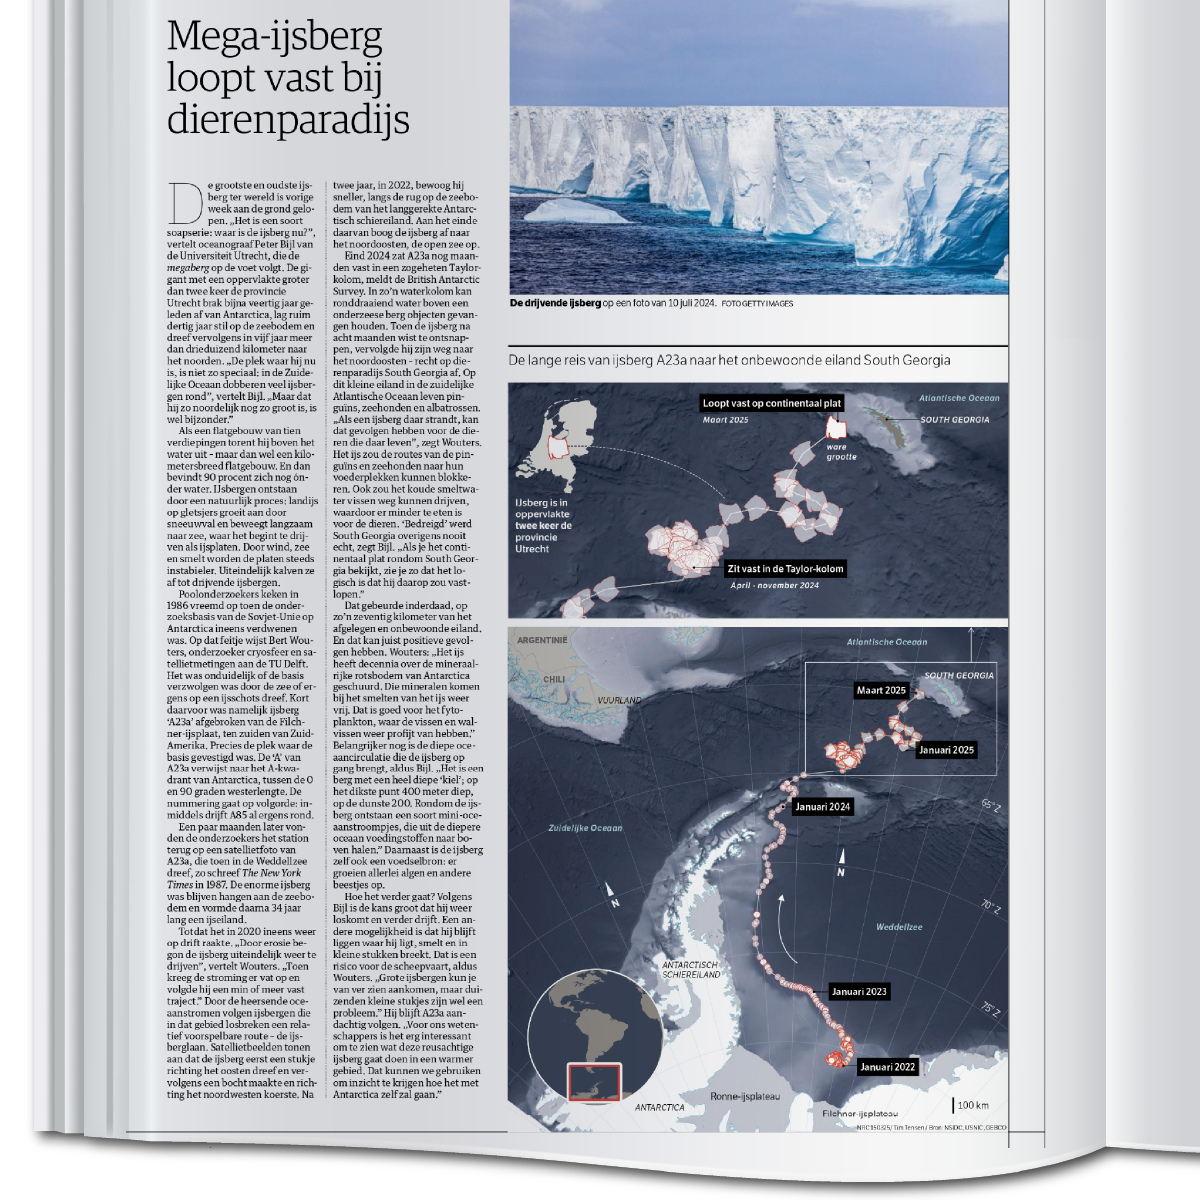
Route of the iceberg from 2022, as published in the print edition of NRC.
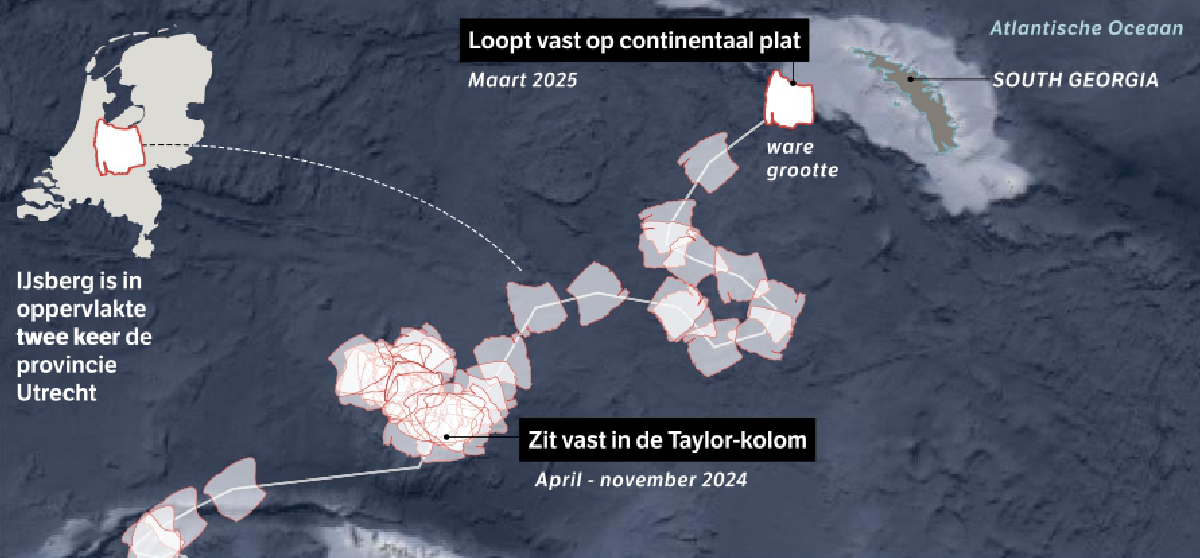
Route of the iceberg and where it eventually runs aground at South Georgia.
Arctic sea ice
Sea ice in the Arctic has been declining since 1979. Using detailed data from the National Snow and Ice Data Center (NSIDC) I showed how both the extent and thickness of the ice are decreasing. The visualisations make clear how exceptional recent years have been.
Animation for the online article showing the decline of sea ice over the years
Graphic showing the development of sea ice extent for other months as well. This makes clear that sea ice is smallest in September and largest in February.
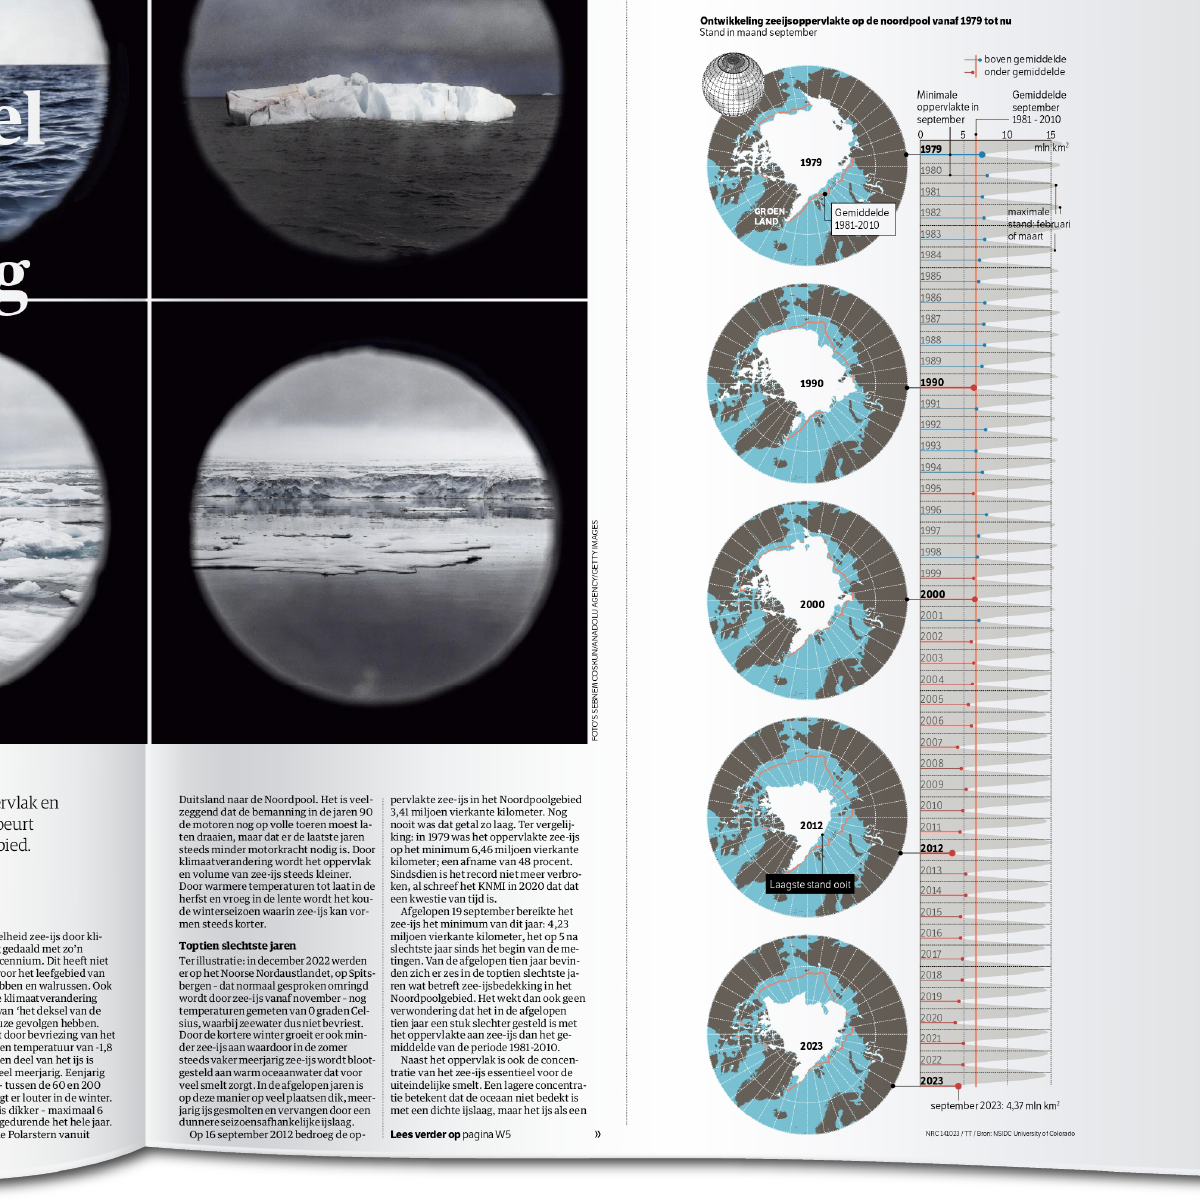
The graphic as published in the print edition of NRC.
Climate year in images
2023 was a year of extremes with a number of remarkable events each month. From wildfires to warming North Atlantic waters to extreme storms and heat. This makes visible how exceptional the year was and how different climate effects manifested themselves around the world.
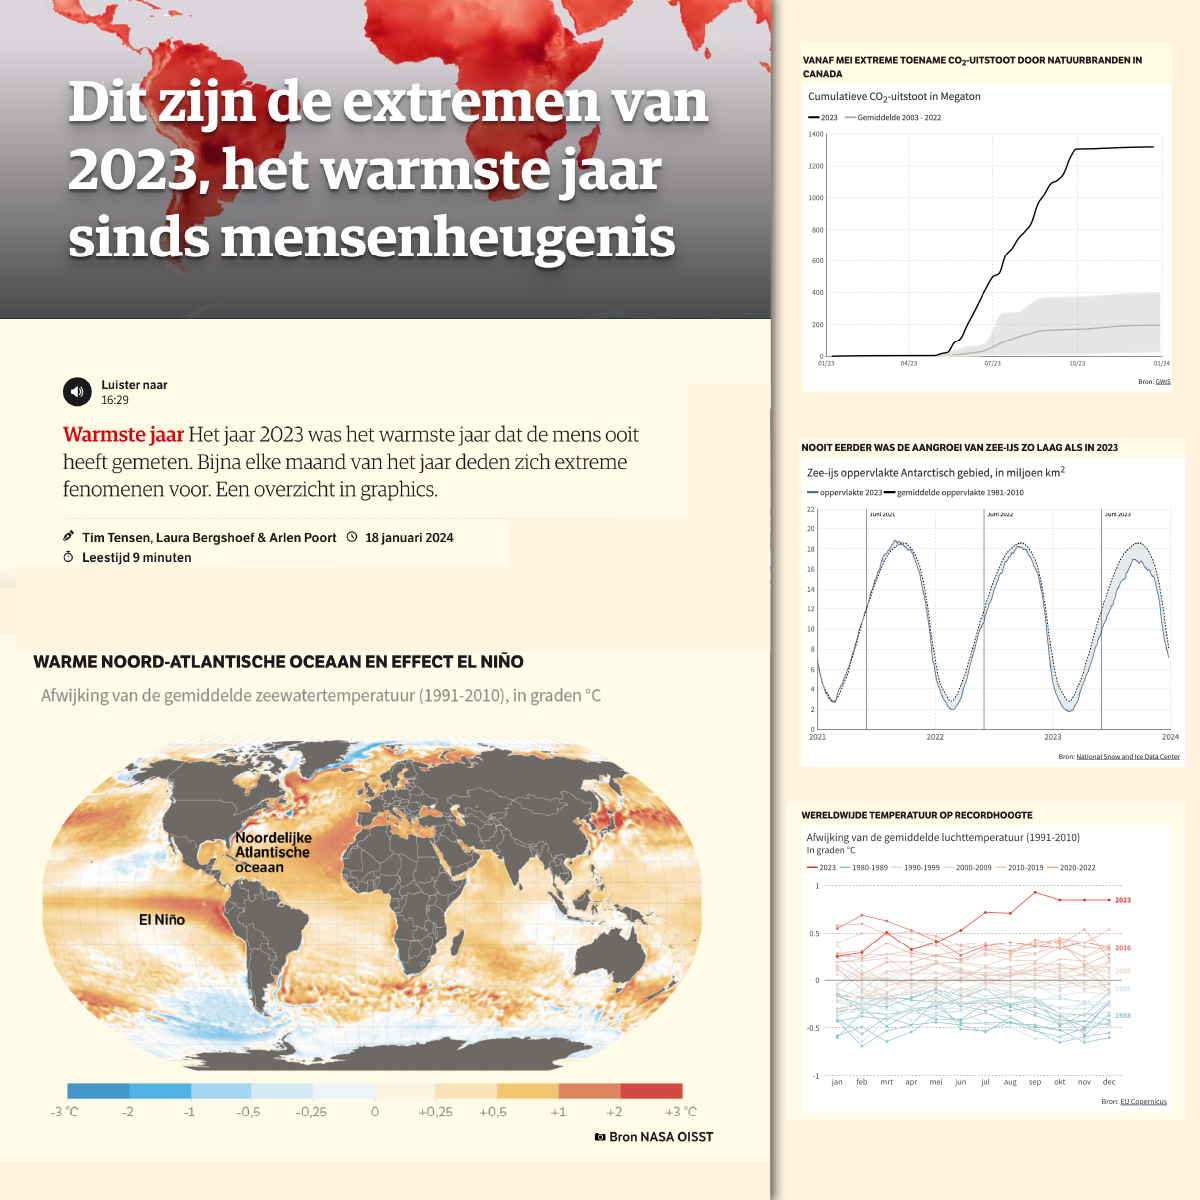
Online article highlighting various examples of extreme phenomena in 2023, including warming ocean temperatures, wildfires in Canada, the decline of sea ice and extreme heat.
Animation of carbon presence in the atmosphere, an indicator of (wild)fires, and the visualisation of wind patterns near southern Mexico clearly showing the path of the hurricane.
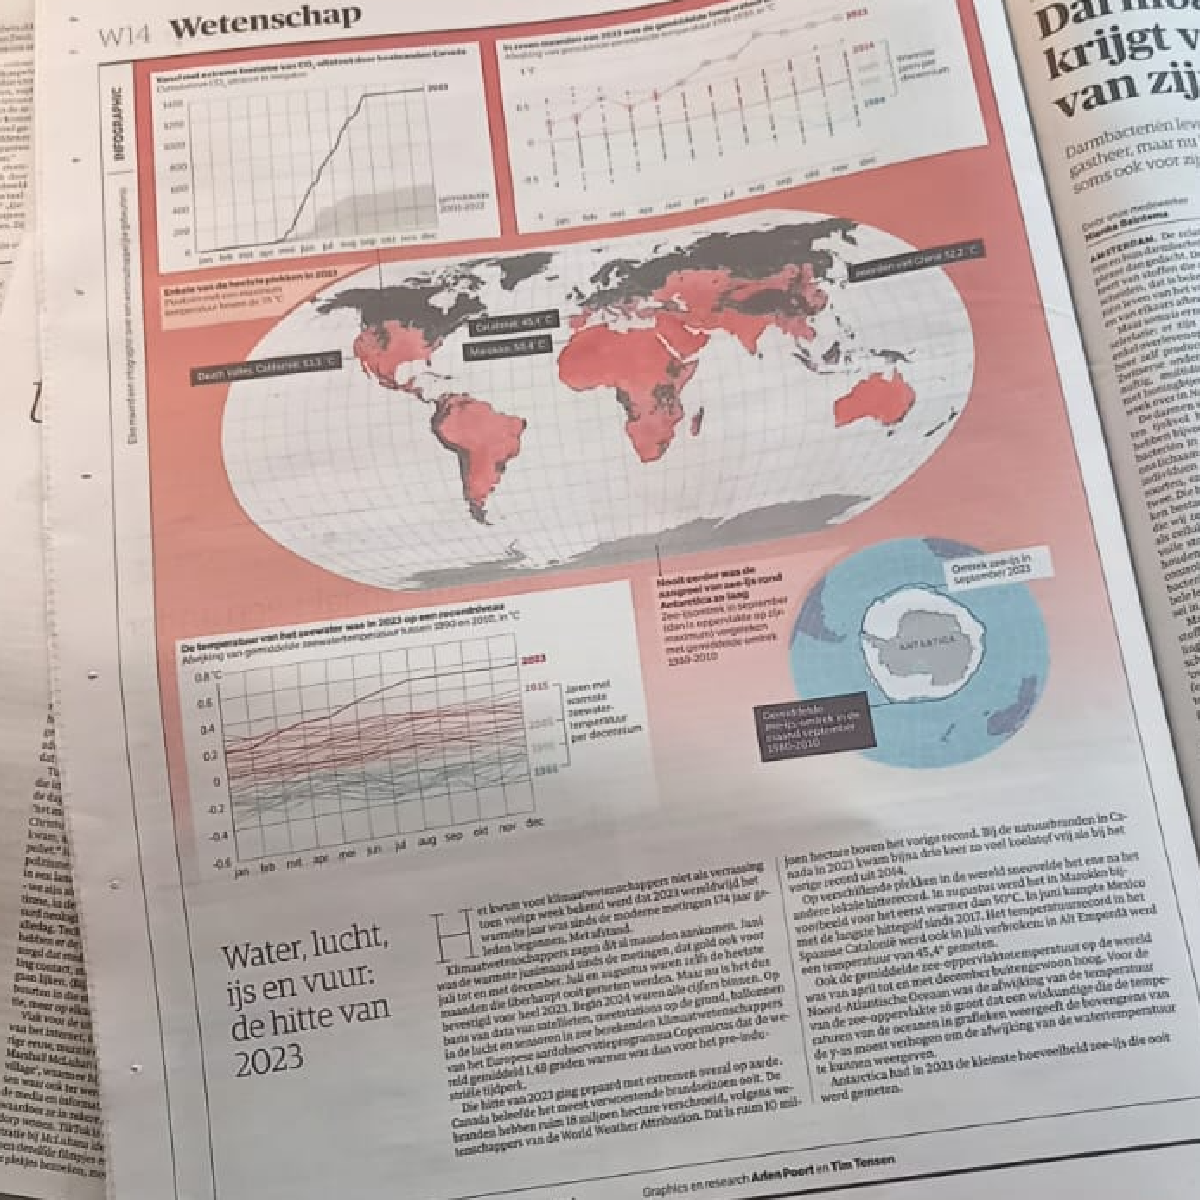
Translation of the graphics for the print edition of NRC.